Hi all,
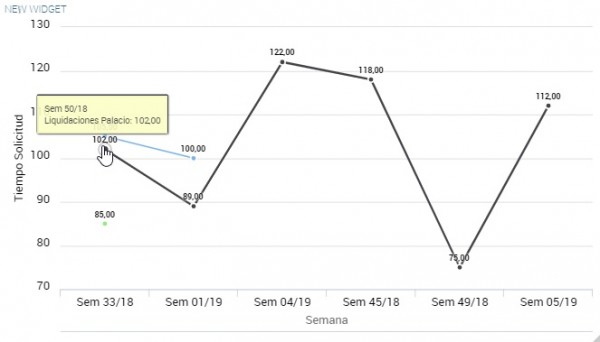
I am making a line chart with one serie (Quantity) and two categories (Week and Branch), so that I can see the number of applications by week and branch. I enabled the option "Second category" to split the chart by category. But data is not showing properly into the chart, for some reason, the chart does not show all the weeks into the x axis, I mean if an application from branch A was made into week 50, it is showed into week 33, just because another application from another branch was made in week 33. And just like that for all the data. Is there a bug with second category in version 6.2.1 or some configuration I am missing? I am using 6.2.1 version in Centos 7 environment. Thanks for the support. Attached image related to the post.